
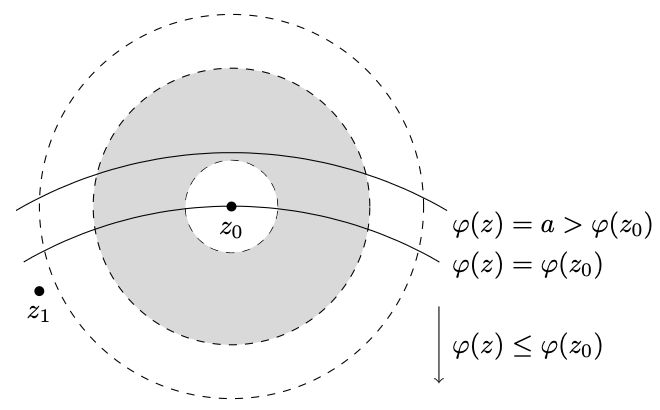
I saw a question on X/Twitter by とと about drawing certain circles, partially filled, together with aligned equations. So, I quickly wrote some TikZ code to demonstrate how such drawings can be done.
This is the result:
And this is the code:
\documentclass[tikz]{standalone}
\usetikzlibrary{positioning}
\usepackage{amsmath}
\begin{document}
\begin{tikzpicture}[dot/.style={circle, fill, inner sep = 1.3pt}]
  \draw node[dot, label = below:$z_0$] (z0) {};
  \draw node[dot, label = below:$z_1$,
    below left = 1 and 2.4 of z0] {};
  \begin{scope}% scope of clipping
    \clip circle (0.6) (-4,-3) rectangle (4,3);
    \filldraw[dashed,fill=gray!30] circle (1.8);
    \draw [dashed] circle (0.6) circle (2.5);
  \end{scope}
  \draw [rotate=90] (-0.72,-0.2) ++(270:2.5) arc (-30:30:5.4) ;
  \draw [rotate=90] (-0.05,-0.3) ++(270:2.5) arc (-30:30:5.6) ;
  \node [anchor=north west] at (2.75,0.1) {$\begin{aligned}
     \varphi(z) &= a > \varphi(z_0)\\
     \varphi(z) &= \varphi(z_0)\\
     \\
     \varphi(z) &\leq \varphi(z_0)
  \end{aligned}$};
  \draw [->] (2.7,-1.3) -- ++ (270:1);
\end{tikzpicture}
\end{document}
To be fast, for positioning, I estimated many coordinates and adjusted them so the result looks good.
Learning TikZ is challenging but really rewarding. A good book can help learning the basics quickly, such as TikZによるLaTeXグラフィックス.