Here are the Code examples of this chapter. These pages are currently being updated over time (adding pictures, captions, and possibly further examples). Visit again soon for updates. Of course, the best way to use this page is together with the book for getting the explanations.
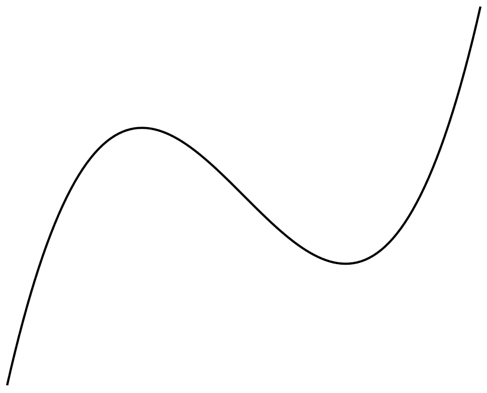
Figure 12.1 – A sample curve without coordinates or parameters
\documentclass[border=10pt]{standalone}
\usepackage{pgfplots}
\begin{document}
\begin{tikzpicture}
  \begin{axis}[axis lines=none]
    \addplot [domain=-3:3, smooth, thick] { x^3 - 5*x };
  \end{axis}
\end{tikzpicture}
\end{document}
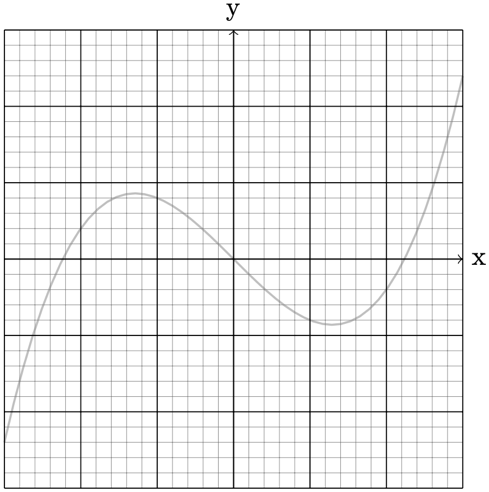
Figure 12.2 – A curve with a grid
\documentclass[border=10pt]{standalone}
\usepackage{pgfplots}
\begin{document}
\begin{tikzpicture}
  \draw[domain=-3:3,samples=50,color=gray!50,thick] plot (\x, \x^3/5 - \x);
  \draw[very thin,gray,step=.2] (-3,-3) grid (3,3);
  \draw[step=1] (-3,-3) grid (3,3);
  \draw[->] (-3,0) -- (3,0) node[right] {x};
  \draw[->] (0,-3) -- (0,3) node[above] {y};
\end{tikzpicture}
\end{document}
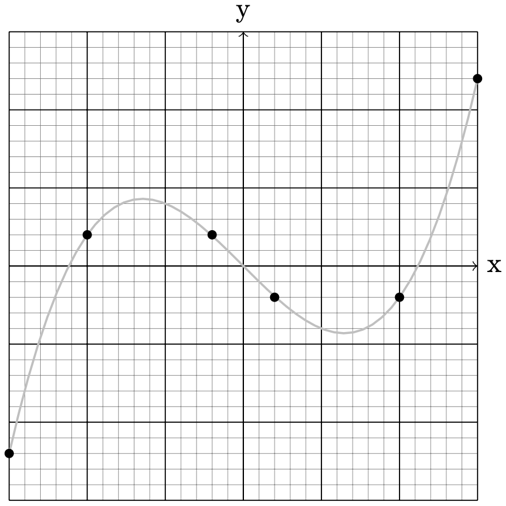
Figure 12.3 – Manually selected points on a curve
\documentclass[border=10pt]{standalone}
\usepackage{pgfplots}
\begin{document}
\begin{tikzpicture}
  \draw[domain=-3:3,samples=50,color=gray!50,thick] plot (\x, \x^3/5 - \x);
  \draw[very thin,gray,step=.2] (-3,-3) grid (3,3);
  \draw[step=1] (-3,-3) grid (3,3);
  \draw[->] (-3,0) -- (3,0) node[right] {x};
  \draw[->] (0,-3) -- (0,3) node[above] {y};
  \foreach \x/\y in {-3/-2.4, -2/0.4, -0.4/0.4, 0.4/-0.4, 2/-0.4, 3/2.4}
    \fill (\x,\y) circle (0.6mm);
\end{tikzpicture}
\end{document}
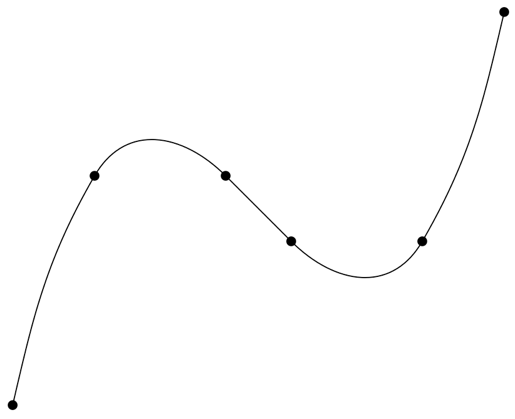
Figure 12.4 – A smooth path through points
\documentclass[border=10pt]{standalone}
\usepackage{pgfplots}
\begin{document}
\begin{tikzpicture}
  \draw[domain=-3:3,samples=50,color=gray!50,thick] plot (\x, \x^3/5 - \x);
  \foreach \x/\y in { -3/-2.4, -2/0.4, -0.4/0.4,
    0.4/-0.4, 2/-0.4, 3/2.4 }
      \fill (\x,\y) circle (0.6mm);
  \draw (-3,-2.4) to[out=77,in=240] (-2,0.4)
    to[out=60,in=135, looseness=1.2] (-0.4,0.4) to[out=-45,in=135] (0.4,-0.4)
    to[out=-45,in=-120,looseness=1.2] (2,-0.4) to[out=60,in=257] (3,2.4);
\end{tikzpicture}
\end{document}
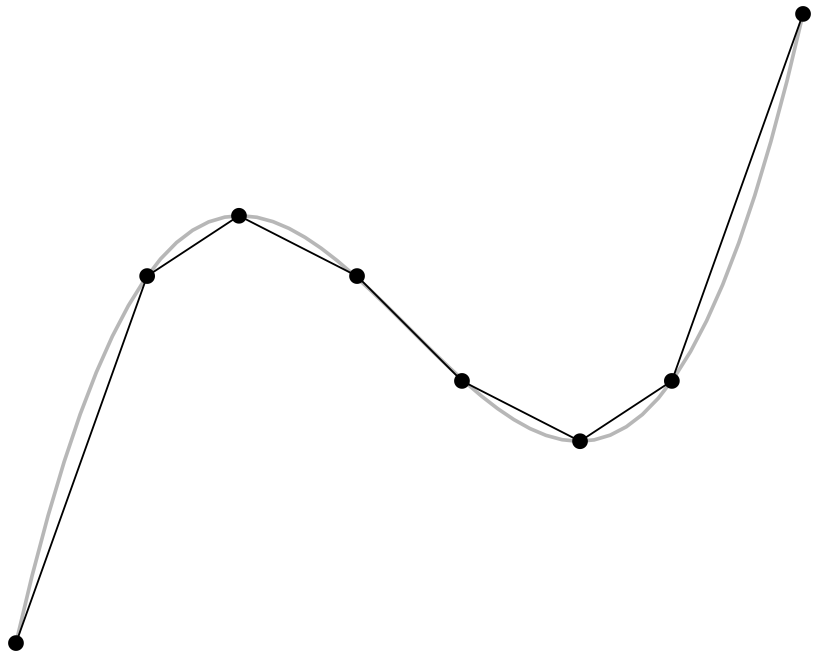
Figure 12.5 – A plot through given coordinates
\documentclass[border=10pt]{standalone}
\usepackage{pgfplots}
\begin{document}
\begin{tikzpicture}
  \draw[domain=-3:3,samples=50,color=gray!50,thick] plot (\x, \x^3/5 - \x);
  \foreach \x/\y in { -3/-2.4, -2/0.4, -0.4/0.4,
    0.4/-0.4, 2/-0.4, 3/2.4 }
      \fill (\x,\y) circle (0.6mm);
  \draw plot coordinates {
    (-3,-2.4) (-2,0.4) (-1.3,0.86) (-0.4,0.4)
    (0.4,-0.4) (1.3,-0.86) (2,-0.4) (3,2.4) };
\end{tikzpicture}
\end{document}
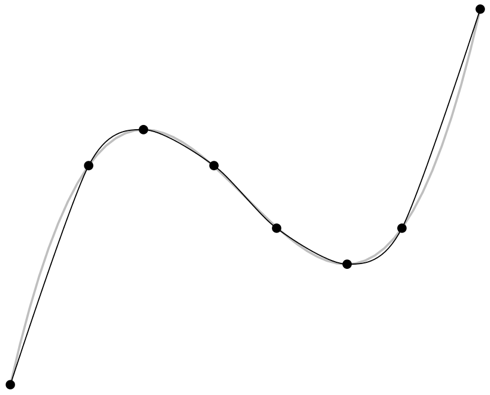
Figure 12.6 – A smoothened plot through the given coordinates
\documentclass[border=10pt]{standalone}
\usepackage{pgfplots}
\begin{document}
\begin{tikzpicture}
  \draw[domain=-3:3,samples=50,color=gray!50,thick] plot (\x, \x^3/5 - \x);
  \foreach \x/\y in { -3/-2.4, -2/0.4, -0.4/0.4,
    0.4/-0.4, 2/-0.4, 3/2.4 }
      \fill (\x,\y) circle (0.6mm);
  \draw plot[smooth] coordinates {
    (-3,-2.4) (-2,0.4) (-1.3,0.86) (-0.4,0.4)
    (0.4,-0.4) (1.3,-0.86) (2,-0.4) (3,2.4) };
\end{tikzpicture}
\end{document}
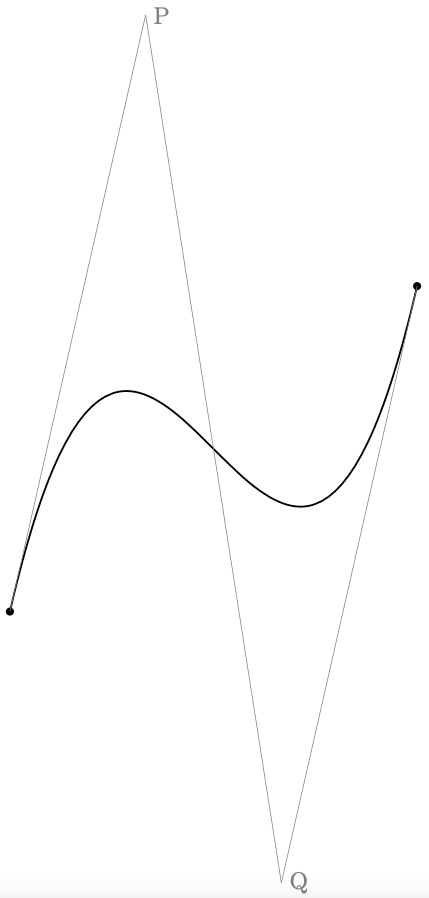
Figure 12.7 – A Bézier curve with control points
\documentclass[tikz,border=10pt]{standalone}
\begin{document}
\begin{tikzpicture}
  \foreach \x/\y in { -3/-2.4, 3/2.4 }
      \fill (\x,\y) circle (0.6mm);
  \draw[thick] (-3,-2.4) .. controls +(77:9) and +(257:9) .. (3,2.4);
  \draw[help lines] (-3,-2.4) -- (-1,6.4) node[right] {P};
  \draw[help lines] (3,2.4) -- (1,-6.4) node[right] {Q};
  \draw[help lines] (-1,6.4) -- (1,-6.4);
\end{tikzpicture}
\end{document}
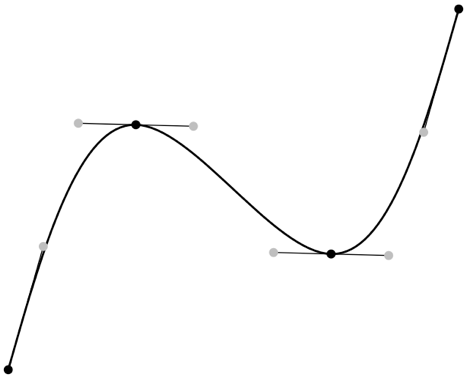
Figure 12.8 – A curve with Bézier splines
\documentclass[tikz,border=10pt]{standalone}
\usetikzlibrary{spline}
\begin{document}
\begin{tikzpicture}
%  \draw[thin,dotted] (-3,-3) grid (3,3);
%  \draw[->] (-3,0) -- (3,0);
%  \draw[->] (0,-3) -- (0,3);
  %\draw[domain=-3:3,samples=50,color=gray!50,thick] plot (\x, \x^3/5 - \x);
  \foreach \x/\y in { -3/-2.4, -1.3/0.86,
    1.3/-0.86, 3/2.4 }
      \fill (\x,\y) circle (0.6mm);
%  \coordinate (A) at (-3,-2.4);
%  \coordinate (B) at (-1.3,0.86);
%  \coordinate (C) at (1.3,-0.86);
%  \coordinate (D) at (3,2.4);
  \draw[thick] (-3,-2.4) to[spline coordinates=S, spline through={(-1.3,0.86)(1.3,-0.86)}] (3,2.4);
  \foreach \i [evaluate=\i as \j using \i+1] in {1,2,...,\tikzsplinesegments} {
    \draw[thin]  (S K-\i) -- (S P-\i)
                      (S K-\j) -- (S Q-\i);
    \fill[gray!50,semithick] (S P-\i) circle (0.6mm);
    \fill[gray!50,semithick] (S Q-\i) circle (0.6mm);
  }
\end{tikzpicture}
\end{document}
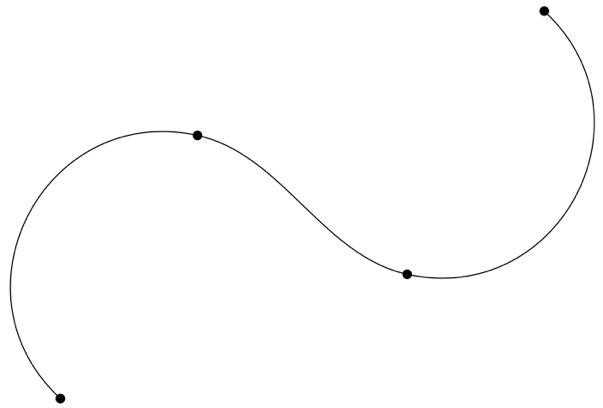
Figure 12.9 – A Hobby curve
\documentclass[tikz,border=10pt]{standalone}
\usetikzlibrary{hobby}
\begin{document}
\begin{tikzpicture}
  \foreach \x/\y in { -3/-2.4, -1.3/0.86,
    1.3/-0.86, 3/2.4 }
      \fill (\x,\y) circle (0.6mm);
  \draw plot[hobby,thick] coordinates { (-3,-2.4) (-1.3,0.86) (1.3,-0.86) (3,2.4)};
\end{tikzpicture}
\end{document}

Figure 12.10 – A closed smooth curve
\documentclass[tikz,border=10pt]{standalone}
\usetikzlibrary{hobby}
\begin{document}
\begin{tikzpicture}
  \foreach \x/\y in { -3/-2.4, -1.3/0.86,
    1.3/-0.86, 3/2.4 }
      \fill (\x,\y) circle (0.6mm);
  \draw (-3,-2.4) to[closed, curve through = {(-1.3,0.86) (1.3,-0.86)}] (3,2.4);
\end{tikzpicture}
\end{document}
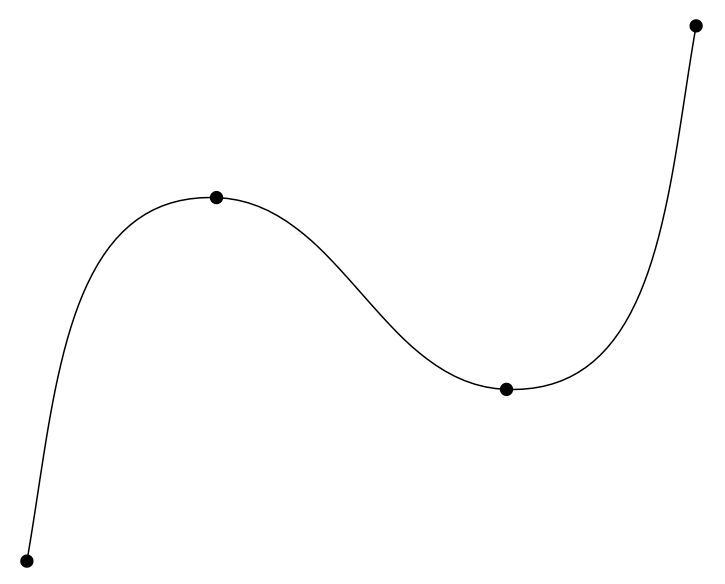
Figure 12.11 – A curve with a specific start and end angle
\documentclass[tikz,border=10pt]{standalone}
\usetikzlibrary{hobby}
\begin{document}
\begin{tikzpicture}
  \foreach \x/\y in { -3/-2.4, -1.3/0.86,
    1.3/-0.86, 3/2.4 }
      \fill (\x,\y) circle (0.6mm);
  \draw (-3,-2.4) to[out angle=80, in angle=260,
    curve through = {(-1.3,0.86) (1.3,-0.86)}] (3,2.4);
\end{tikzpicture}
\end{document}
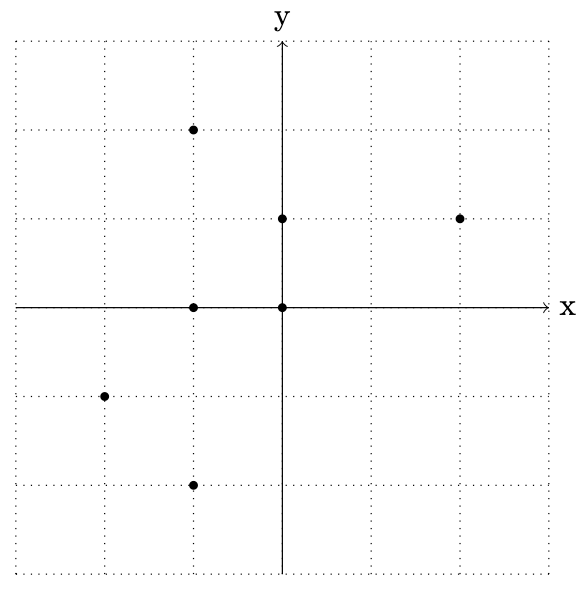
Figure 12.12 – Points on the plane
\documentclass[tikz,border=10pt]{standalone}
\usetikzlibrary{hobby}
\begin{document}
\begin{tikzpicture}
  \draw[step=1,thin,dotted] (-3,-3) grid (3,3);
  \draw[->] (-3,0) -- (3,0) node[right] {x};
  \draw[->] (0,-3) -- (0,3) node[above] {y};
  \foreach \c in {(0,0),(-1,-2),(-2,-1),(-1,0),
    (-1,2),(0,1),(2,1)} \fill \c circle (0.5mm);
\end{tikzpicture}
\end{document}
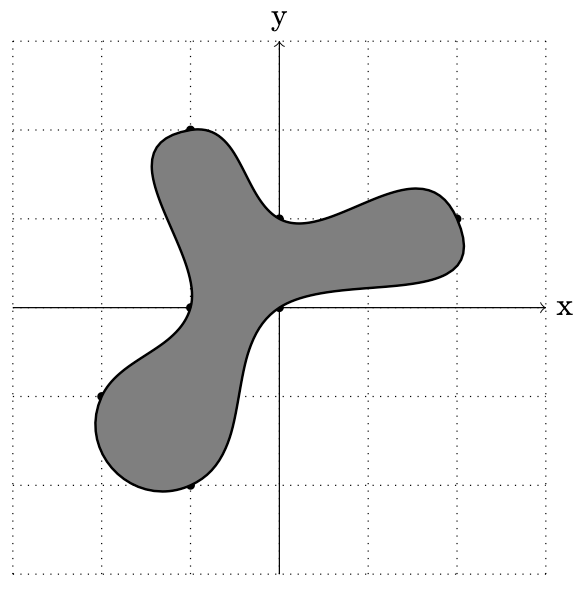
Figure 12.13 – A very smooth curve through points on the plane
\documentclass[tikz,border=10pt]{standalone}
\usetikzlibrary{hobby}
\begin{document}
\begin{tikzpicture}
  \draw[step=1,thin,dotted] (-3,-3) grid (3,3);
  \draw[->] (-3,0) -- (3,0) node[right] {x};
  \draw[->] (0,-3) -- (0,3) node[above] {y};
  \foreach \c in {(0,0),(-1,-2),(-2,-1),(-1,0),
    (-1,2),(0,1),(2,1)} \fill \c circle (0.5mm);
  \draw[thick, fill=gray] (0,0) to[closed, curve through =
    { (-1,-2) (-2,-1) (-1,0) (-1,2) (0,1) }] (2,1);
\end{tikzpicture}
\end{document}
Please rate (and possibly review) the book on Amazon if you got it there, your feedback means much to me and helps to get an extended second edition!
Go to next chapter.