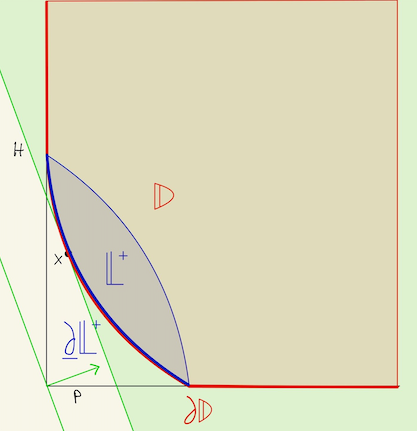
On X (Twitter), I saw a post by Ben Levinstein asking if any AI could do a good job turning hand-drawn diagrams into TikZ equivalents. I guess AI is not ready for this yet, but I can show how I would do that with this example by Ben:
A preparation can be like this:
- Start with a node that loads the hand-drawn diagrams simply with \includegraphics. Scale and position it as you like.
- Draw a rectangular grid so you can estimate coordinate values.
- Add numbers for a grid axis to help quickly see coordinate values.
So, we could have this code for the start:
\documentclass[tikz,border=10pt]{standalone}
\begin{document}
\begin{tikzpicture}
  \node at (2.85,3) {\includegraphics[scale=0.18]{drawing}};
  \draw[step=0.5, dotted] (-1,-1) grid (7,7);
  \draw[step=1]           (-1,-1) grid (7,7);
  \foreach \i in {1,...,6} { \node at (\i,-0.2) {\i};\node at (-0.2,\i) {\i};}
\end{tikzpicture}
\end{document}
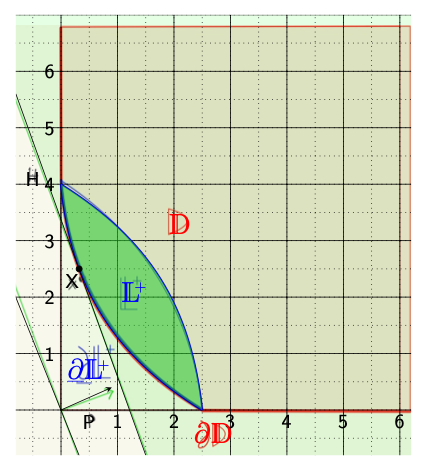
Now, I can add node by node and edges using approximate coordinates with the help of the grid and the numbers. Position each one and adjust the coordinate values until they overlap with the original hand-drawn element. Together, we would have this code:
\documentclass[tikz,border=10pt]{standalone}
\usepackage{dsfont,relsize}
\begin{document}
\begin{tikzpicture}[every node/.style = {font=\sffamily}]
  \clip (-0.8,-0.8) rectangle (6.2,7);
  \filldraw[green!10] (-0.8,5.6) -- (1.5,-0.8) -- (6.2,-0.8)
                   -- (6.2,7)    -- (-0.8,7)   --cycle;
  \filldraw[thick, green!20, draw=red] (0,0) rectangle (6,6.8);
  \node[opacity=0.8] at (2.85,3) {\includegraphics[scale=0.18]{drawing}};
  \draw[step=0.5, dotted] (-2,-2) grid (8,8);
  \draw[step=1]           (-2,-2) grid (8,8);
  \foreach \i in {1,...,6} { \node at (\i,-0.2) {\i};\node at (-0.2,\i) {\i};}
  \coordinate (A) at (0,4);
  \coordinate (B) at (2.5,0);
  \draw[thick, blue!90!black]       (A) to[bend left = 26] (B);
  \draw[very thick, blue!70!black]  (B) to[bend left = 26] (A);
  \fill[green!70!gray, opacity=0.5] (A) to[bend left = 26] (B)
                                        to[bend left = 26] (A);
  \draw (-0.8,5.6) -- (1.5,-0.8);
  \draw [shift={(-0.93,-0.93)}] (-0.5,4.5) -- (1.5,-0.5);
  \draw [-stealth] (0,0) -- (0.9,0.4);
  \node at (-0.5,4.1) {H};
  \node at (0.2,2.3)  {X};
  \node at (0.5,-0.2) {P};
  \filldraw (0.32,2.5) circle(1.5pt);
  \node[font=\Large\color{red}]  at (2.1,3.3)  {$\mathds{D}$};
  \node[font=\Large\color{red}]  at (2.7,-0.4) {$\partial\mathds{D}$};
  \node[font=\Large\color{blue}] at (1.3,2.1)  {$\mathds{L}^\mathsmaller{\!\!+}$};
  \node[font=\Large\color{blue}] at (0.5,0.7)  {$\underline{\partial}
                                                 \mathds{L}^\mathsmaller{\!\!+}$};
\end{tikzpicture}
\end{document}
Overlapping, with added transparency so the hand-drawing is less visible:
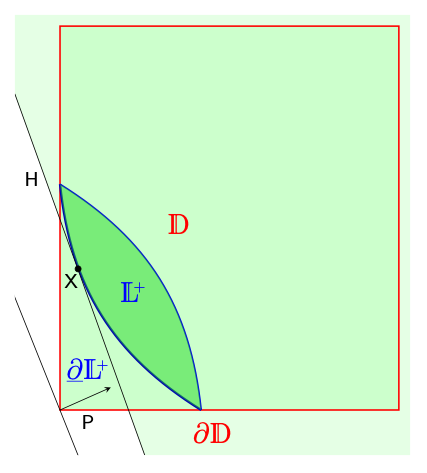
Now, you can comment out the grid, numbers, and the node with includegraphics, just keep it if you need it later on for more fine-tuning or additions:
\documentclass[tikz,border=10pt]{standalone}
\usepackage{dsfont,relsize}
\begin{document}
\begin{tikzpicture}[every node/.style = {font=\sffamily}]
  \clip (-0.8,-0.8) rectangle (6.2,7);
  \filldraw[green!10] (-0.8,5.6) -- (1.5,-0.8) -- (6.2,-0.8)
                   -- (6.2,7)    -- (-0.8,7)   --cycle;
  \filldraw[thick, green!20, draw=red] (0,0) rectangle (6,6.8);
  %\node[opacity=0.8] at (2.85,3) {\includegraphics[scale=0.18]{drawing}};
  %\draw[step=0.5, dotted] (-2,-2) grid (8,8);
  %\draw[step=1]           (-2,-2) grid (8,8);
  %\foreach \i in {1,...,6} { \node at (\i,-0.2) {\i};\node at (-0.2,\i) {\i};}
  \coordinate (A) at (0,4);
  \coordinate (B) at (2.5,0);
  \draw[thick, blue!90!black]       (A) to[bend left = 26] (B);
  \draw[very thick, blue!70!black]  (B) to[bend left = 26] (A);
  \fill[green!70!gray, opacity=0.5] (A) to[bend left = 26] (B)
                                        to[bend left = 26] (A);
  \draw (-0.8,5.6) -- (1.5,-0.8);
  \draw [shift={(-0.93,-0.93)}] (-0.5,4.5) -- (1.5,-0.5);
  \draw [-stealth] (0,0) -- (0.9,0.4);
  \node at (-0.5,4.1) {H};
  \node at (0.2,2.3)  {X};
  \node at (0.5,-0.2) {P};
  \filldraw (0.32,2.5) circle(1.5pt);
  \node[font=\Large\color{red}]  at (2.1,3.3)  {$\mathds{D}$};
  \node[font=\Large\color{red}]  at (2.7,-0.4) {$\partial\mathds{D}$};
  \node[font=\Large\color{blue}] at (1.3,2.1)  {$\mathds{L}^\mathsmaller{\!\!+}$};
  \node[font=\Large\color{blue}] at (0.5,0.7)  {$\underline{\partial}
                                                 \mathds{L}^\mathsmaller{\!\!+}$};
\end{tikzpicture}
\end{document}
This is the final result:
It’s still hand-made TikZ with estimated coordinates, but a quick approach to replicate a drawing in TikZ. If you want to draw smooth curves based on a hand-drawing, take a look at Drawing Smooth Curves from the recently published TikZ book.


